3 February 2021
Deals in the updated MetaTrader 5 synthetic Market Depth chart
MetaQuotes
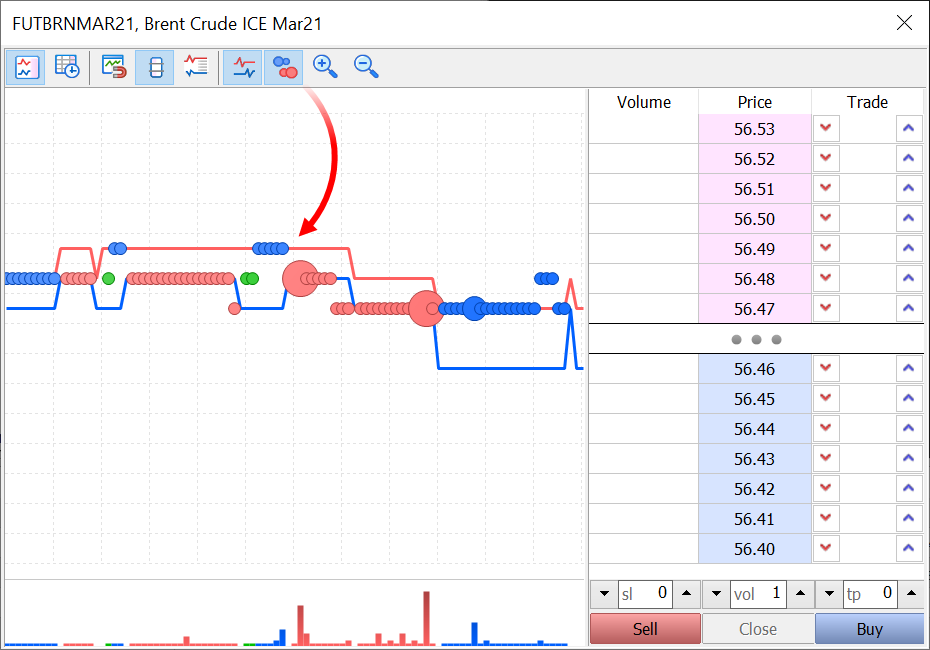
The updated chart in MetaTrader 5 build 2755 displays all transactions executed on the exchange, which are now shown as colored circles.

- Red circles show Sell trades.
- Blue circles show Buy trades.
- Green is used when the direction is undefined. If an exchange does not provide trading direction data, this characteristic is determined based on the deal price as compared to Bid and Ask. A Buy transaction is executed at Ask or a higher price and a Sell transaction is executed at Bid or a lower price. If the transaction price is between Ask and Bid, the direction is considered to be undefined.
The circle size depends on the deal volume. The volumes are additionally shown as a histogram below the tick chart.
Depth of Market is one of the basic tools reflecting supply and demand for liquid tradable assets. It displays buy and sell offers for a financial
instrument at the best prices, which are closest to the market. Using the Depth of Market window in MetaTrader 5, you can buy or sell
financial assets at the current market price, as well as place pending orders at the specified price.
Use the all-in-one multi-asset MetaTrader 5 platform to trade Forex, Stocks and Futures. MetaTrader 5 provides advanced technical analysis tools, as well as algorithmic and social trading features. Enjoy mobile trading from a smartphone and a tablet or use the web platform to work from any browser on any device.
- Updated Popup Prices in MetaTrader 5
- 4 reasons to rent a VPS for trading
- SquaredFinancial announced the launch of MetaTrader 5 with futures and shares support
- How to make $1,000,000 off algorithmic trading? Use MQL5.com services!
- JFD Group introduces commission-free ETF trading on MetaTrader 5 for investors in Europe